
LASR Explainer
The primary guidebook for my LASR project.

Introduction and Links
This article will serve as the primary guidebook for my League-Adjusted Standardized Rating (LASR) project. I will update it as necessary when relevant changes are made.
Below is a list of my articles chronicling the creation, development, and exploration of various aspects of the project.
Introducing LASR, Providing Much-Needed Context to Your Favorite Baseball Statistics
Wait, LASR isn’t the same thing as Baseball Savant percentiles?
The Collapse of the Qualifier (And a solution I’ve applied to my LASR project)
Generally I will not be revising those articles, so some may contain outdated explanations. All changes to the process and scope of LASR, both past and future, will be summarized in this article.
Overview
League-Adjusted Standardized Rating (LASR) is a project in which a wide range of baseball statistics are translated to the same scale, one modeled after the traditional 20-80 scouting scale. On the scale, 50 represents average and every 10 points above or below that is equal to 1 standard deviation. The project is designed to provide context to stats we may not have a comprehensive notion of quality for. It tells us exactly how impressive a .300 batting average is these days, whether a 15% whiff rate is desirable or not, the difference between a 3% home run rate (HR%) in 1915 and 2015, and much more.
I created this project because I like being able to contextualize stats to make more sense of them, but the current most popular methods of doing so in baseball (+ stats and percentiles) do not account for the spread of data. I believe the data’s spread is too important to continue ignoring. My background and a more thorough explanation of why I began this project is included in my LASR introduction article.
Public Access
As of this writing, LASR data is not publicly available, but I hope to edit this section with a big update soon.
Data
I have calculated LASR scores for most available stats for every individual player season in the following datasets:
AL/NL Hitters (1876-2025)
AL/NL Pitchers (1876-2025)
Negro League Hitters (1920-1948)
Negro League Pitchers (1920-1948)
Currently, all of the data comes from FanGraphs. If you are not already a supporter, I highly encourage you to become one. They deserve every ounce of support they can get.
All of the coding I have conducted for this project has been done in the programming language R.
There are some new advanced stats (i.e. hitter bat speeds, pitcher spin rates) that I have begun translating, but I need to put more time into ensuring their accuracy and reliability before officially adding them to the project. It’s on the list.
Calculation Process
The ratings are essentially z-scores. That’s the number of standard deviations above or below the mean (average) an individual data point is. A standard deviation is a measure of spread in a dataset; most data falls within -3 and 3 standard deviations of the mean. Perhaps someday I’ll write an article on the calculation and value of standard deviations, but for now if you’re interested in learning more about them, I encourage you to peruse the extensive information you can find online.
Here’s the step-by-step process in calculating a LASR value:
Establish a pool of “league regular” players for each season. These qualifier pools are composed of the top X players by playing time (Total Batters Faced (TBF) for pitchers, Plate Appearances (PA) for hitters, and Innings Played (Inn) for fielders), where X is a predetermined value multiplied by the number of teams in the league. These values for the AL/NL datasets are listed below. (Note: for Negro League data, I use 6 position players (for both hitting and fielding stats, since position and innings played data is incomplete) and 3 pitchers per team (the lines between SP and RP were quite blurry).) The reasoning for using this method is discussed in my article on the qualifier threshold.

Among these established pools, calculate the mean and standard deviation for all stats I deem reliable and relevant. (Note: if stats are not already expressed as rates, I turn them into rates. This means FanGraphs Wins Above Replacement (fWAR), for example, is actually fWAR/PA for hitters and fWAR/TBF for pitchers).
For each individual player, calculate their z-scores in all of these stats. This is done by subtracting the league mean from the player’s value, then dividing by the league standard deviation.
For players who fell short of qualifying for the league regular pool, their z-scores are multiplied by a scalar equal to their progress toward qualification.
For stats in which it is preferable to have a low value (such as HR% for pitchers and K% for hitters), z-scores are negated. This is denoted with a “-” in front of the stat on LASR graphics (except on pitcher stats like ERA where that is obvious).
All z-scores are then translated to the 20-80 scale. This is done by multiplying the value by 10 and adding it to 50.
Since the traditional scale typically uses increments of 5, the LASR value is finalized with a rounding to the nearest 5.
Example
Let’s calculate Giancarlo Stanton’s 2025 HR% LASR value as an example.
Establish a qualifier pool of “league regular” players.
Based on the framework laid out above, the pool will be the top 180 hitters by PA (30 teams, 6 hitters per team in the league).
In 2025 the pool actually included the top 181 hitters, since Austin Riley and Andrew Vaughn tied for 180th place with 447 PA. They are in the pool along with any hitter with more PA; any hitter with 446 PA or fewer is not included.
Calculate the mean and standard deviation.
Among this pool, the mean HR% was 0.0348 and the standard deviation was 0.0151.
Calculate the player’s z-score.
Stanton’s HR% was 0.0854. The z-score is (0.0854 - 0.0348) / 0.0151 = 3.3510.
Adjust for non-qualified players.
Stanton only had 281 PA in 2025. To be in the qualifier pool, he would have needed 447 PA. So, his progress toward qualification is 281/447 = 0.6286.
His z-score is multiplied by this scalar: 3.3510 * 0.6286 = 2.1066.
If a lower value is preferable, negate the stat.
Hitters want higher HR%, so this step is not applicable (if it was, I would just multiply 2.1066 by -1).
Translate to the 20-80 scale.
2.1066 * 10 + 50 = 71.066
Round to the nearest 5.
71.066 is rounded to 70.
Graphics
I currently have developed two different types of graphics to display LASR scores:
Multi-Stat Single-Season. Example: several statistics from Juan Soto’s 2025 season.

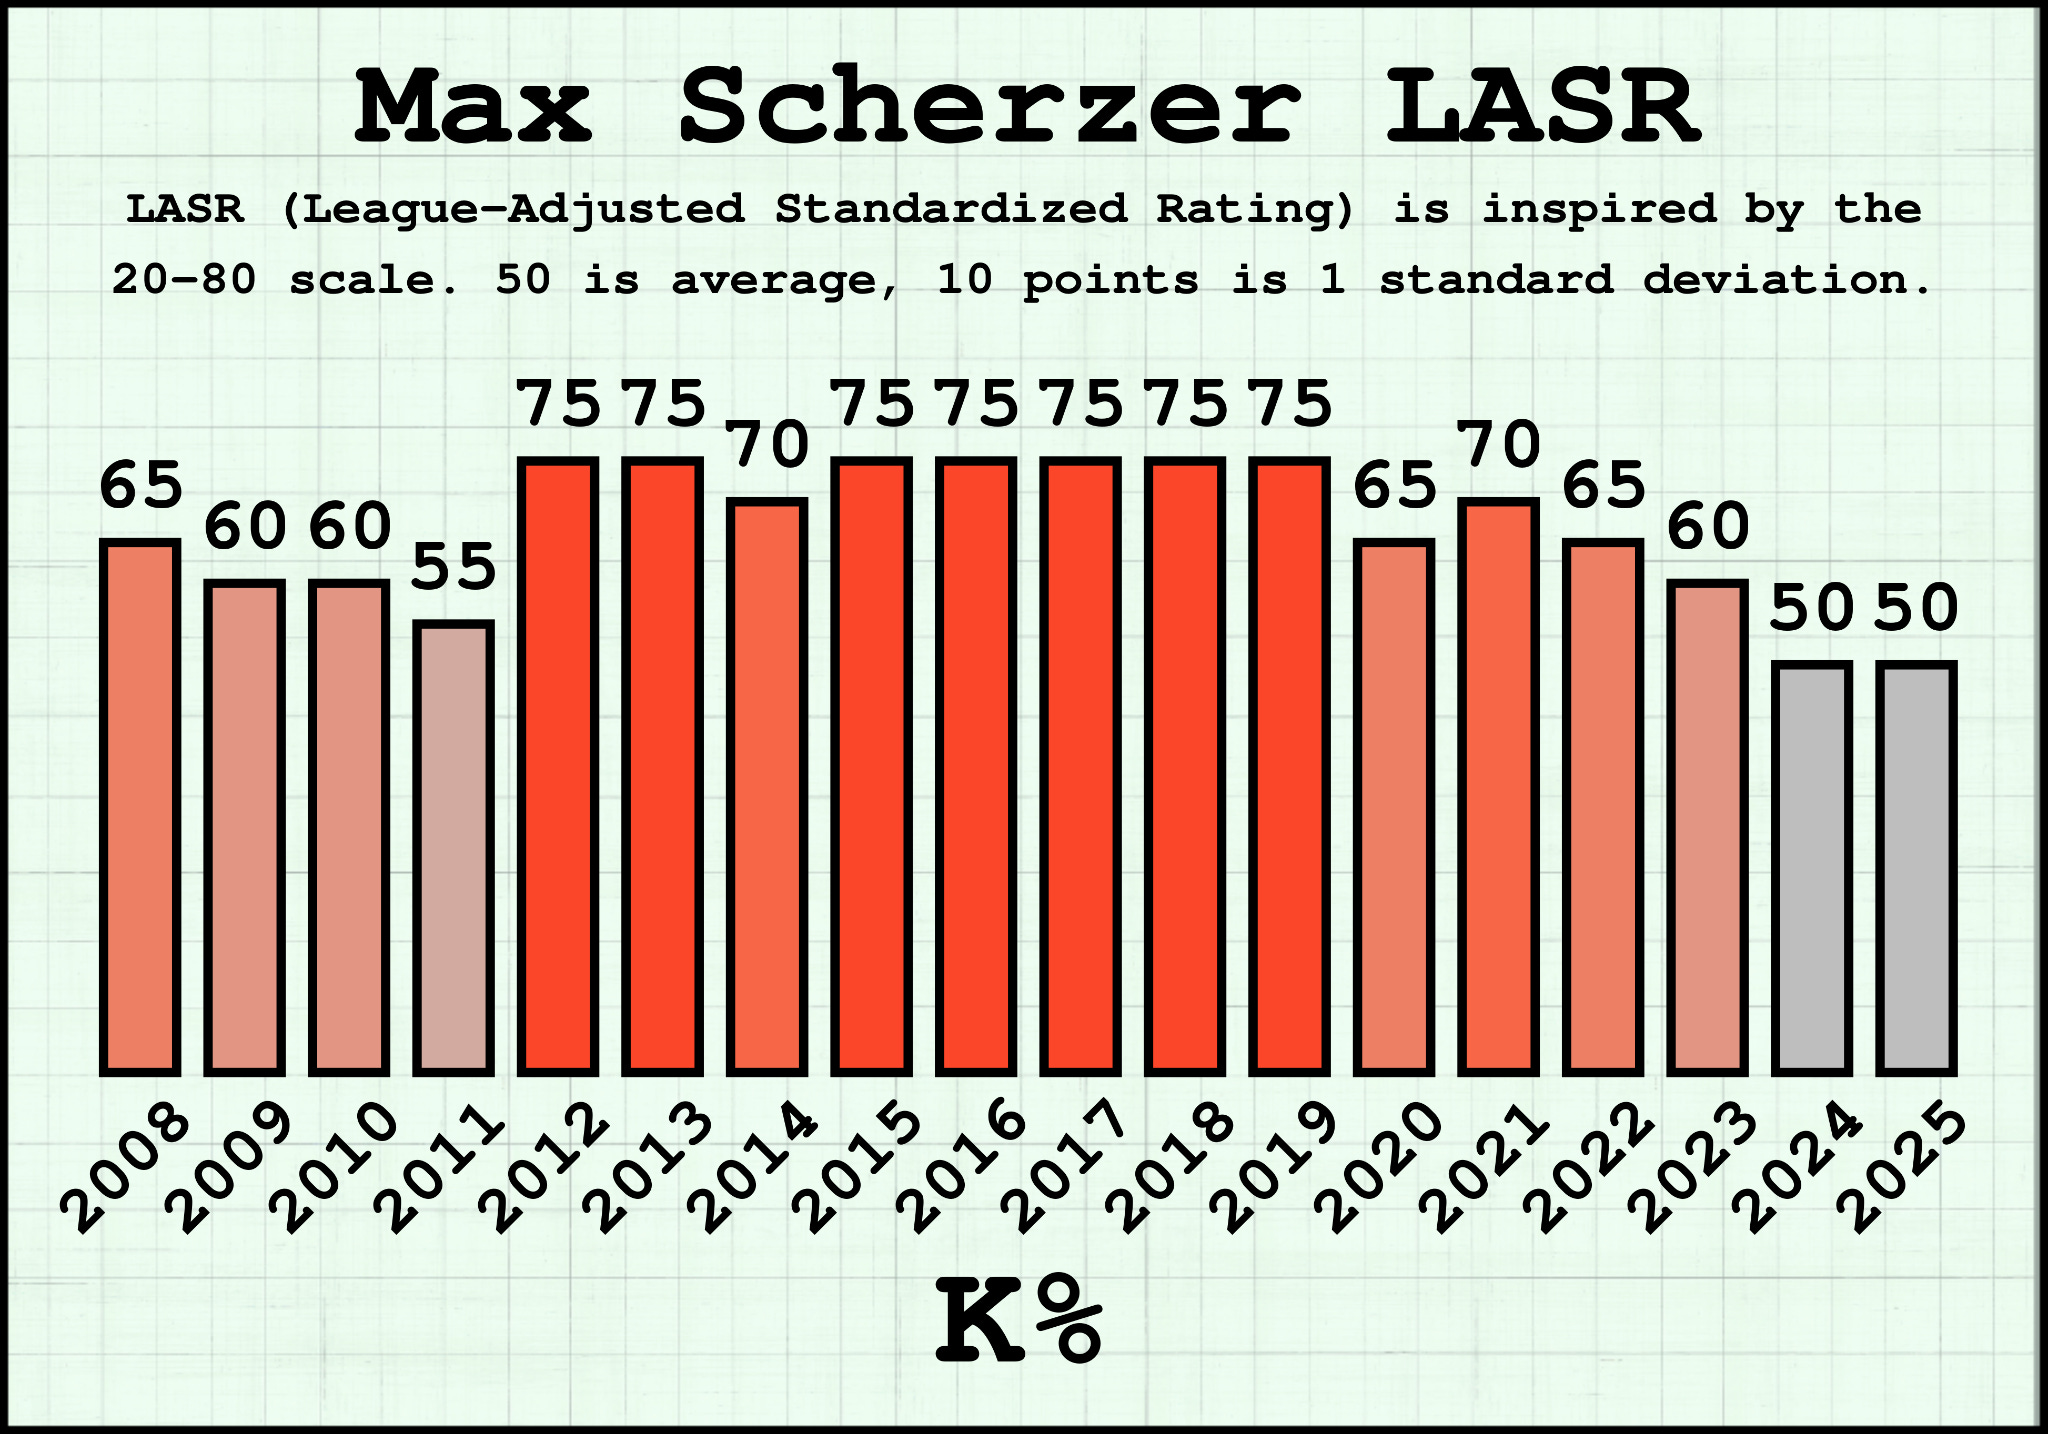
Single-Stat Full-Career. Example: career progression of Max Scherzer’s strikeout rate (K%).
FAQ
What is the usefulness of LASR?
I have primarily been using LASR to get a better idea of player quality and type. Even though I’m a lifelong baseball fan, I find it difficult to keep track of “how good” a stat value is. That might be because of major shifts in modern trends (like batting average generally decreasing) or because I don’t have the same level of experience assessing the quality of advanced stats (like chase rate or zone rate) as I do traditional stats (like Earned Run Average (ERA) or its estimators). Whenever I conduct a player evaluation and find myself frustrated in wrapping my head around their strengths and weaknesses, LASR helps me put it all in a helpful context.
Others may find different uses for LASR (hopefully), but that’s how I use it.
Why are there values below 20 or above 80 if it’s called a 20-80 scale?
The scale is generally referred to as 20-80 because most data points (approximately 99.7% in normally distributed datasets) fall within -3 and 3 standard deviations of the mean. Values below 20 and above 80 are true outliers and quite rare. Admittedly, baseball’s scouting scale typically puts hard caps on those boundaries – i.e. a scout will not report a player’s Power tool as an 85 or 90 even if it truly is that remarkable. However, I like to measure how much of an outlier a player really is, so I do not include those caps.
Where do I learn more about the “regular” versions of these stats?
At some point I want to put together a glossary of my own, but for now I encourage you to check out the FanGraphs Library Stat Glossary to learn more. I know I’ve had to consult it often to make sure I know what’s being measured. Often, a quick Google search will give you a good idea of the basics. And once you know what a stat aims to measure, you don’t even need to figure out what the good or bad values are – just use LASR!
Do you plan on translating data from non-MLB datasets?
Yes, future expansions of the project will hopefully include the following datasets and more: Minor League, NPB, KBO, WPBL, college baseball, independent league baseball, and possibly even different sports.
Why are all underlying counting stats turned into rate stats?
Though baseball fans do often have a good sense of quality for some counting stats, all underlying stats are expressed as rates because they more accurately reflect player abilities. Someone who hits 20 home runs in 500 PA has displayed a different power profile than someone who hit the same amount in 300 PA. The playing time adjustment I incorporate works well in tandem with this concept, rewarding players who contribute full-time and fairly dinging players who may have achieved abnormally high rates through small sample size flukes.
Are LASR scores for starting pitchers and relief pitchers calculated separately?
Yes. Any pitcher who started at least half of his games pitched is treated as a starter; all others are treated as relievers. This does create the rare strange outcome, such as a reliever having an extremely high Quality Start rate (QS%) because most of his peers threw none. However, this is the best method of dealing with that blurry SP/RP line that I’ve come up with.
What are some updates you’re planning on making?
This project has a long way to go before I feel like I’m “done” with it. Here’s just a few things I plan to work on in the indefinite future:
Making it accessible to the public, for both web and mobile users. This is currently Goal #1 and (knock on wood) I’m pretty close to making it happen.
As mentioned above, the inclusion of more baseball datasets and potentially other sports data.
Different types of graphics, such as league leaders, grouping players by type, career progressions for multiple stats, and more.
An option for users to change the scale, such as regular z-scores (-3 to 3) or “video game ratings” (0 to 100), as well as options for varying degrees of rounding.
A method of determining a current general ability based on data weighted for recency and correlation strength. For example, an estimate of a player’s current Power tool, using recent LASR grades for HR%, Barrel%, EV, etc.
Projections of future performance. This may include creating a projection system of my own, but since there’s no need to reinvent a wheel, there are already effective projection systems out there that I can look into translating.
An option to include the raw value of a stat on the graphic – though this would likely have to involve flipping the orientation of the bars.
Translations of newer advanced stats. For hitters, Statcast started releasing data on bat speed, attack angle, and others a couple years ago. For pitchers, I’d like to translate pitch characteristics for different pitch types, such as velocity, perceived velocity, horizontal/vertical movement, spin rate, etc.
I’ll cut myself off here to avoid giving away ALL of my plans.
Thank You
If you made it this far, I can’t tell you how much I appreciate your interest in this project. Thank you. I’ve put quite a bit of work into it already and I’m hopeful it’s still in its pre-arb years.
I’m terrible at promoting myself, but the ugly truth is, in order for me to be able to dedicate significant time and energy to this project, I need to at least have the illusion that it will compensate me somehow. As of now, that strictly comes from paid subscriptions to this Substack. I’ve been posting here about once a month, which I’m hoping to improve upon, but I try my best to write thoughtful and entertaining articles that are full of substance and worth your time. I know the world is falling to pieces and money is hard to come by these days, but if you are able to provide a bit of support, I would be very grateful.
Go baseball ✌️