LASR Update: It's Prettier Now!

LASR: League-Adjusted Standardized Rating; a project that puts all stats on the same 20-80 scouting scale. Average is 50, a standard deviation is 10 points. Averages and standard deviations are calculated using qualifiers, and adjustments are made for playing time. First introduced here.
Okay, so it’s been a hot minute here, but I come fully-loaded with excuses and updates. My first excuse will be a wild gesture toward the end of human civilization as we know it, giddily accelerated by a small group of greedy, self-infatuated billionaires who somehow don’t even need to pretend not to be evil anymore. But this is a baseball newsletter and baseball season is approaching, so even though it’s dangerous to stick our heads fully in the sand, a lighthearted positive distraction could do us all some good.
My last post was in late December and highlighted the top 3 free agent pitchers of the offseason. I claimed at the end of that piece that I would be wrapping up my free agency overview next time, taking more deep dives into the next tier of free agent pitchers. In the meantime, all of those pitchers signed new contracts. Any analysis of their free agency markets at this point would be as enlightening as a prediction of who will win the 2008 World Series (call me crazy, but I’ve got a good feeling about the Phillies!).
In January, I actually did some preliminary writeups on Jack Flaherty, Shane Bieber, and Sean Manaea, but then I went to Mexico for a couple weeks and let those drafts get dragged into the depths of the Pacific Ocean. That’s my second excuse; my last is that I’ve been doing other baseball writing at Call to the Pen, where I actually have an editor and team to try not to ignore. It’s been a great experience to see what’s happening in that little corner of the baseball writing industry. I just wrapped up a 3-part series highlighting 9 players who I’ve predicted to break out in 2025, and I’m looking forward to being right about 1 or 2 of them. If you want to check it out, here’s the most recent piece, which also has links to the others.
High and Outside is my own backyard batting cage, though, and I want to get as many reps in here as I do at the local diamond. And though I’ve broken my promise of another free agency overview, I’ve got an exciting update that probably should have batted leadoff here: LASR got a makeover!
Just to remind you, before developing this graphic style I had been taking screenshots of the LASR project on Tableau, which looked something like this:
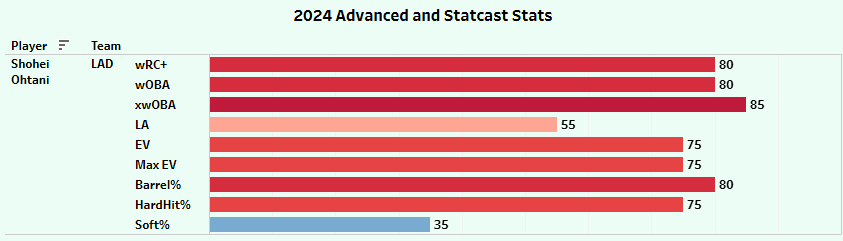
The screenshots were good enough at the time, when I was focused mainly on just getting the project out there, but I realized pretty quickly that they were too blurry and too boring. It was also difficult to mix and match different stats in the same view, which is important for telling stories with specific narratives in mind. If there’s anything I’ve learned in my experience with statistics, it’s: “Find a story, then find the stats that help you tell it.” (Note: this is actually a dangerous way to approach stats, but in baseball writing it’s practically required.)
As of now, the Tableau version of the LASR project remains the only source available to the public. That isn’t because I’m purposely keeping it to myself and barking at anybody who tries to touch it. The graph I’ve created above was made in R – the (excellent) program I use to transform the data in the first place – and it will take some extra work to make it easily accessible to others. I hear it’s possible, but there are some knots I would have to untangle first. Don’t worry, though, it’s on my long and chaotic to-do list.
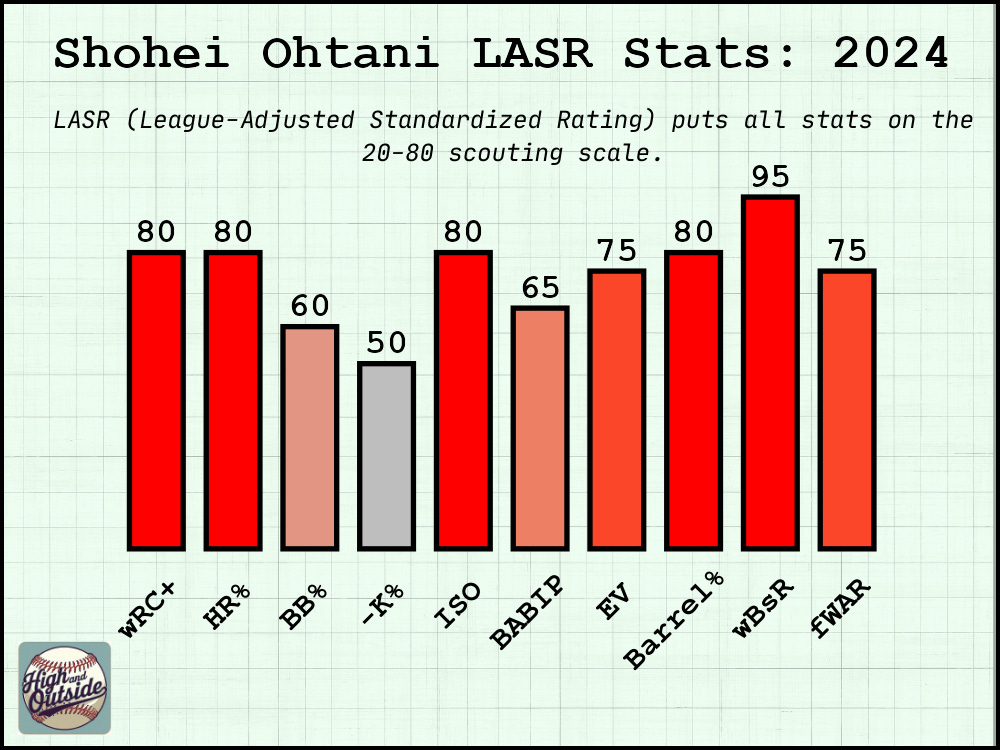
Meanwhile, I can at least create these snazzy little graphs myself and share them with the world in a much more eye-catching way than I’d been capable of before. And hey, maybe it’s better that I hold the key. Oh, you want Shohei Ohtani’s 2024 LASR card? You’re gonna have to go through me first! Wait, you already have it...
Seriously, though, if you have a particular request, feel free to reach out. I will do absolutely anything for my 3 fans.
With that in mind, let’s take a tour of the new LASR and see what it can provide...
Any Individual Season in MLB History
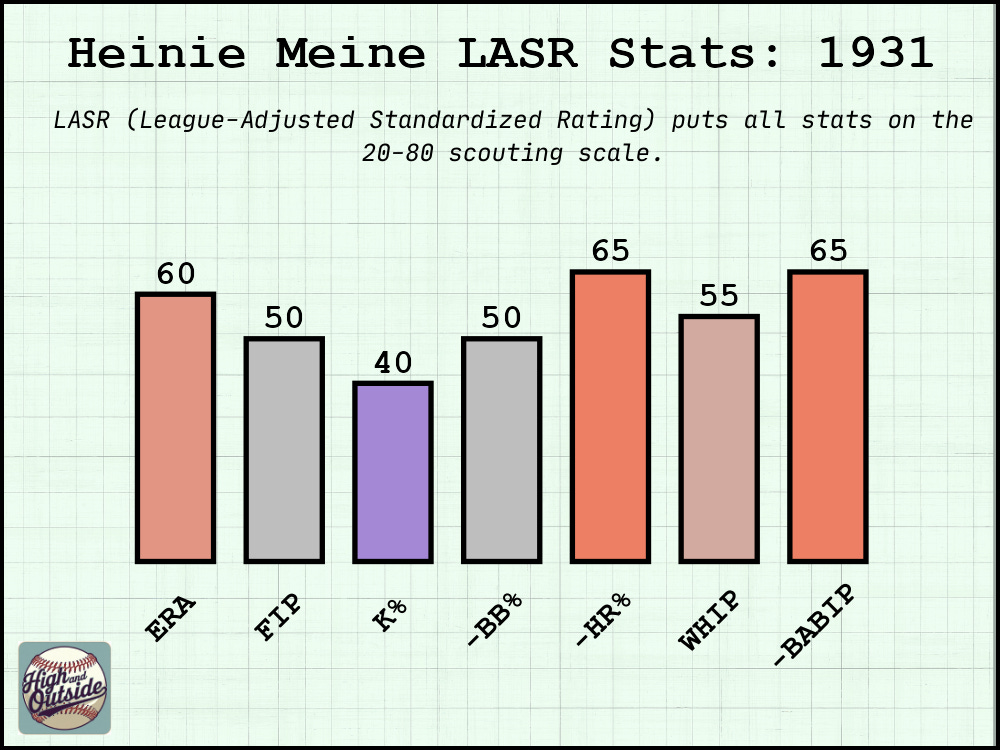
Ever get a hankering for some Heinie Meine 1931 stats? Same, bro. Meine, whose first and last names I really hope are a rhyming pair, was a 35-year old in the midst of an unspectacular career when he surprisingly led the National League in wins and innings pitched in 1931. As with any other player whose stats were accrued in a starkly different era, though, it’s a challenge to gauge how impressive his 2.98 ERA was – not to mention his 87 walks and 58 strikeouts in 284 innings. If a pitcher put up that combination in today’s game, it would practically break the sport. It’s a dead giveaway that we need LASR’s context to judge Meine’s performance.
Something you may notice here (and in the Ohtani graph earlier) is the negative symbol in front of some stats. That indicates that those values have been flipped across the 50-line because it is preferable to have lower values. For example, Meine’s -HR% LASR score of 65 means he was 1.5 standard deviations above average at preventing home runs. Great job, Heine! That seemed to be his greatest weapon in 1931 – though he was also the benefactor of some good luck, with a -BABIP LASR of 65. Combined with the difference between his ERA and FIP LASR grades, Meine would have been projected to decline in performance if he was being evaluated today. And that’s exactly what happened: 1931 was the peak of Meine’s career by far.
Though this might be obvious, I do want to note that many stats are not available for most of MLB history. I’d love to know whether Heinie Meine was great at limiting opposing hitters’ launch angles and exit velocities, but in 1931 the best they could give you was something like, “He baffled the opposing batsmen, scattering but a handful of feeble knocks as he kept enemy clubs utterly at his mercy.” Unfortunately, LASR can’t translate this for us, so we’re left with just a few basic stats from those humble times.
Anyway, here’s a few more examples that I won’t drone on about:


The Progression of a Stat Throughout a Career

Mr. October was known for his postseason heroics, his brash interactions with the media, and of course the time he was mind-controlled to attempt to assassinate the Queen. Beyond these tidbits, Reggie Jackson was highly regarded league-wide as a powerful home run hitter who smacked balls over the fence with regularity. And that’s true – but I remember the first time I studied his home run totals and was surprised to see numbers that seemed too low for his reputation.
Sure, Reggie had a couple 40+ home run seasons, and he crossed the 30 barrier a few more times, but there were significantly more years with home run totals in the 20s than I expected. From ages 24 to 33, the prime peak decade for most hitters – Reggie included, more or less – he hit less than 30 home runs more often than not. If you’re looking at those numbers today, you can’t help but feel a little let down. Here’s this legendary slugger, and in those 10 peak years he never hit more homers than Ketel Marte hit last year. It must have been even more disarming looking back during the steroid era, when Reggie’s career-high of 47 home runs would have been yawn-worthy.
As you might be able to guess, this is all a preamble to “LASR can help!” When we put his home run percentage in perspective, we can see that he was indeed a consistently excellent power hitter, even when the totals didn’t reach grandiose heights. Let’s take 1972 for example. He hit 25 home runs in 573 plate appearances that year, which we can see translates to a HR% LASR of 65. In the year 2000, Darin Erstad had a career year, smacking 25 home runs of his own. Let’s see where that put him on the LASR scale:

That’s right: with the same number of home runs, Reggie Jackson was about 1.5 standard deviations above average in 1972 while Darin Erstad was approximately average at the skill in 2000. For the sake of transparency, I am pulling a bit of a statistical sleight of hand here: Erstad collected a remarkable 747 plate appearances that year, 174 more than Reggie. With the drastic difference in denominators, their home run percentages had quite a sizable gap: 4.4% to 3.3%. However, this just proves the point further: context is essential in evaluating player performance, and LASR is capable of easily providing that context. Reggie Jackson was a power hitter even when he hit 20-something homers, and Darin Erstad couldn’t get close to the Queen even if he tried.
Okay, some more examples of career progressions:


Progression by Month (Hitters Only, 2016-Present) (For Now)

Did you know that Aaron Judge had a pretty good season in 2024? That’s only news to you if you stopped paying attention in April (and then tuned back in during the 5th inning of World Series Game 5). A significant talking point around Judge’s extraordinary performance last year was, “Imagine if he’d been this good in April too.” Well, LASR agrees, and expresses it clear as day: next to the otherworldly 100 OPS LASR in May and two other months above 80, that league-average performance in April looks downright pitiful. What was he doing? Didn’t he know he was Aaron Judge?
With this monthly breakdown, I can now track the changes in a player’s performance over the course of a season, in relation to league averages and standard deviations. This provides a more granular view of when a player gets hot or cold, something you wouldn’t notice if you’re only looking at season-long stats. Using this, we can potentially see hitters who heated up over the course of a season, potentially giving hope that they “figured something out” that can carry over into the next full season. With complementary information about injuries, we can also make estimations on their possible lingering effects.
As noted in the section header, I only have the ability to get monthly stats for hitters from 2016 and beyond for now. There appears to be a function broken in the baseballr package that I use – which I otherwise highly recommend – and I’ve submitted a ticket to the creator to get that fixed. That would hopefully give me access to monthly pitching and fielding stats; though it may be a blessing in disguise that those aren’t working, since they are more prone to small sample size randomness. A starting pitcher only gets 5 or 6 starts per month, after all, and if one of them is a dud, there goes the month.
Some more examples:


Subset of Months (Again, Hitters Only, 2016-Present)
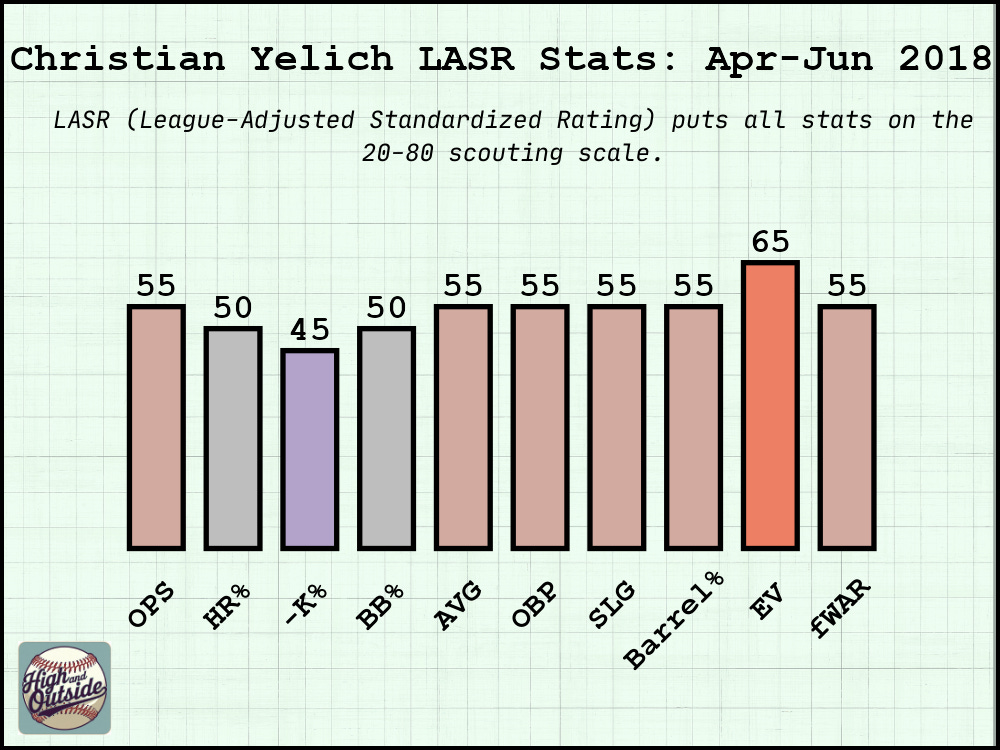
Christian Yelich was a good player before being traded to the Brewers. In his full seasons with the Marlins, he consistently put up 3-5 bWAR, providing a reliable bat with respectable power – though his first two full seasons saw single-digit home run totals. In the two seasons prior to switching teams, he posted OPS values of .859 and .807, and in the first half of 2018 – his first year with the Brewers – he was right in line with his established level, putting up an .823 OPS on the way to his first All-Star selection. He wasn’t a starter in that game, but he hit a home run off the bench.
That homer was a sign of things to come. His OPS was already climbing a few games before the All-Star break, but after that his bat went berserk, with a second-half OPS of 1.219 that raised his season value to a satisfactory 1.000. If all this talk of raw, untranslated OPS values is confusing you, I apologize; here’s LASR once again to the rescue:

I do feel compelled to make a note that probably doesn’t change your interpretation, but would feel wrong to exclude. The LASR values in these subsets of months are not calculated altogether as one date range; they are actually weighted averages of the individual months included. For example, in the graph above the July through September OPS LASR of 75 is calculated by taking the OPS LASR grades for July, August, and September and averaging them, with a plate appearance “weight” applied. This wasn’t my first choice; theoretically I’d love to get all stats for all players between particular dates, but that part of the baseballr function was not working properly either. I had to settle for getting stats for the months separately, then combining them in the best way I could think of.
It was helpful to get some practice with weighted averages, though, because that’s on my list of features to include in career-long LASR values as well. I want to be able to evaluate players based on their entire careers, but it wouldn’t make sense to just take plain averages, since I wouldn’t want a season with 30 plate appearances to mean the same thing as a season with 600. Since I now know I can do weighted averages with months, it should be pretty simple to do the same with years.
However, that’s just one bullet point on a long list of features I’d love to add to this project. I could hide away for months, make significant changes, and give big updates each time I post, but I’d rather focus on one tweak at a time. Besides, the actual baseball season is fast approaching and with it comes boundless opportunities to focus on and write about things that aren’t related to LASR. But don’t worry, I’ve always got “what’s next” plans for the project, and I’m certainly open to suggestions.
Oh, and yes – Mexico was awesome.